
Fear The No Fear
By Tyler Durden

Submitted by Lance Roberts via RealInvestmentAdvice.com,
Here we go again. Another Friday. Another attempted breakout above the 2100 level on the S&P 500. Over the last couple of months, as shown below, this has become a regular occurrence.
While the market is once again extremely overbought on a weekly basis, the employment report on Friday which showed a historically abnormal surge in June jobs growth, despite a weaker than expected wage increase and further negative revisions to May’s report, sent investors scrambling into the market. That push on Friday was enough to trigger a short-term buy signal and set the market up for a push to all-time highs.
However, don’t get too excited just yet. There are several things that need to happen before you going jumping head first into the pool.
- We have seen repeated breakout attempts on Friday’s previously which have failed to hold into the next week. Therefore, IF this breakout is going to succeed, allowing us to potentially increase equity allocation risk, it must hold through next Friday.
- The overbought condition on a weekly basis needs to be resolved somewhat to allow enough buying power to push stocks above 2135 with some voracity. A failure at that resistance level could lead to a bigger retracement back into previous trading range of 2040-2100.
- Interest rates, as shown below, need to start “buying the rally” showing a shift from “safety” back into “risk” as seen following the April deviation. (Gold bars show declining rates correlated with falling asset prices. Green bars are rising rates correlated rising assets.)
- Volume needs to start expanding, second chart below, to confirm “conviction“ to a continuation of the “bull market.”

It is important to note, as shown in the chart above, that recent short-term “sell-signals” have been reversed temporarily. However, these are very short-term signals in nature and can be quickly reversed so caution is advised at getting overly excited at the moment.
As shown below, while the market is trying to breakout above 2100, it is doing so with the market, as stated above, extremely overbought and within the context of a negative divergence from longer-term price trends. As shown, these negative divergences have tended to be resolved, although they can take time, with a market correction. Support levels current reside at 2080, 2040, 2030 and 1990.
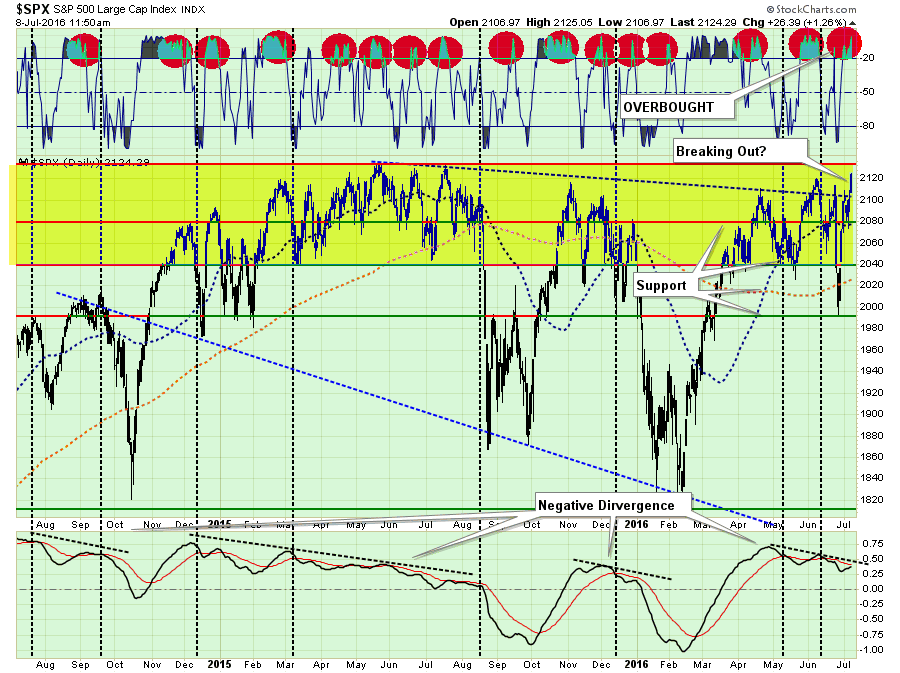
Importantly, this is not a “bearish” outlook, but rather one that simply suggests caution before adding to current levels of portfolio risk.
As shown in the chart below, the market has continued to vacillate between one event to the next. From central bankers to job reports, the markets have not been trading on fundamentals but rather or not there will be more support from global Central Bankers. The interesting thing about the jobs report on Friday is that it removes another excuse from the Fed NOT to hike rates in July. They won’t, of course, but according to their own …read more
Source: Fear The No Fear


