
Is Tail Risk Really At An 18-Month Low?
By Tyler Durden
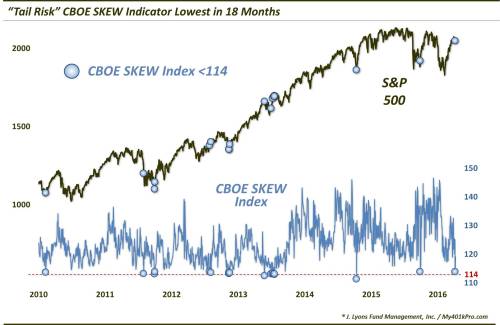
The CBOE SKEW Index just closed at its lowest level since October 2014 – but is tail risk in the stock market really that low?
We often stress the importance of taking indicators and data at face value as much as possible, avoiding the temptation to qualify or *asterisk* readings that don’t seem to fit the narrative. That said, it is also important to be familiar enough with an indicator’s behavior to recognize when truly atypical or outlier readings are issued. And speaking of outliers, a good example of such readings occurred last October in the CBOE SKEW Index, and possibly the other day.
As a refresher, SKEW is calculated from S&P 500 out-of-the-money options measuring perceived tail risk, i.e., an outlier event two or more standard deviations below the mean. Essentially, it measures options traders’ perceived risk of a major decline (more at CBOE.com). Typically, the SKEW ranges from 100 to 150. Readings close to 100 indicate that the perceived probability of an outlier return is negligible whereas readings approaching 150 suggest the probability is significant.
On October 12, 2015, the SKEW hit an all-time high reading of 148.92, indicating the highest perceived tail risk in the indicator’s history. The odd thing about the reading was that stocks were a mere 2 weeks into a rally off of the considerable depths of the September lows. Typically, extreme high levels on the SKEW have occurred with the market tight-roping at 52-week highs. This was hardly the case in October and those unusual circumstances caused us to question the normally noteworthy signal.
Today, we find ourselves questioning the reading in the SKEW once again – but from the other side of the spectrum. That is because, despite the ~12% stock market rally over the past 2 months, the CBOE SKEW Index closed at its lowest level (113.8) in a year and a half. This was also just the 18th reading below 114 since 2009.
If we take the reading at face value, it suggests good things to come for stocks over the short to intermediate-term. Consider the returns following the prior 17 SKEW readings below 114 since 2009.

Now these returns were accumulated during an overall extremely bullish environment. Nevertheless, median returns from 1 month to 6 months were far above the norm of the period, with a perfect 17-0 record 6 months out.
So why wouldn’t we take the recent signal at face value? Well, if you are wondering if perceived tail risk can really be at an 18-month low following a monster 2-month rally, you are wondering the right thing. A glance at the chart reveals that most, but not all, of the previous 17 SKEW readings since 2009 occurred near short to intermediate-term lows in the market. The recent reading on April 8 came with the S&P 500 some 12% above its 2-month low.
This does not match …read more
Source: Is Tail Risk Really At An 18-Month Low?


